Assignment 3
Joseph Bickson
CEO/Chairman
Industrial Engineering, Senior
[email protected]
eLearning Pack ID: IE673-Spring-2014-10-03
Introduction & Objectives
Applied Methodology Description
Main Body of the Project
Process Control Charts
Control charts for variable
Control charts for attribute
Collaboration
Missing Data
Results
Summary and further work needed
References
Social Networking
This is MY work nobody helped or advised
Introduction & Objectives
The main purpose of this assignment is helping make Bickson Technologies, the 5th company more competitive through process improvement and process control analysis and a quantitative, computational solution. The tool that is going to be utilized is control charts for variables and attributes. We will also use the “Ranky-State Library” link that Dr. Ranky put in the e-book.
Our goal at Bickson Technologies is to satisfy our customers by providing them with best services at a very low cost. We also take pride in the fact that our services benefit the environment and help reduce our carbon foot print significantly. We intend to provide quality maintenance services for pipelines and valves. Our process shall be statistically controlled in order to provide optimum services that our clients can be happy about. We intend to identify our limitations. Any areas that can be study through our process charts, or control charts will be studied. We will take corrective measures and set up back up plans respectively with TQM philosophy in mind.
Applied Methodology Description
The applied methodology that we are planning on using is TQM graphing methods, like statistical analysis and control charts. We intend to use the template that Dr. Ranky provided in the e-book we will construct a control charts based on the data that is collected through our computers and monitoring equipment and use the control limits to interpret our graph by looking at the upper and lower control limits. We intend to look for outliers. If our process is not control we intend look back and figure out why our chart is not in control meaning that our result must be between the upper and lower control limits.
Main Body of Project
Our clients expect nothing but the best from us. We also have high expectation for ourselves. Our processes are documented and also tested in order to assure quality control. Our TQM management philosophy gives us the tool to analyze our processes from a mathematical point of view where we get real numbers. Those numbers allow us to control our processes. That way we can provide better services for our clients. We want to guarantee zero defects in our processes. We are in agreement with our vendors; that way we do not have to the materials and the equipment that we purchased in order to assure zero defects, since we deal with the procurement of materials. From our side of bargain; we make that our maintenance and installation procedure has no mistake.
Process
Control Charts
Control charts for variables
One on the processes that Bickson Technologies wants to control is the pressure relief mechanism in the event of high pressure and high temperature. The way that we set up our system is that at every mile of the pipeline we have a pressure relief valve. If the temperature and pressure are above the threshold limit, our controller is program to send signal to activate a pressure relieve valve pressure relieve valve. Pressure is let out of the valve and everything would be back to normal theoretically. If that fails and gasket or valve is blown; our controller would activate nearby shutdown valve and immediately our Robot/AI maintenance crew would be also notified to provide the necessary repair. Since our business is to prevent disaster and also minimize the damage if there is a disaster. We want our Robotics/AI maintenance crew to respond to those rare and devastating occurrences in less than 5 minutes. We cannot allow hazardous materials to flow on the ground or the ocean for more than 5 minutes. We set out to fix the problem by using a process control chart.
We took a sample 25 cases in which of those pressure relief valves fails to contain the rise in pressure in the pipes and the gaskets are blown. We assume there are hazardous materials are flowing off the pipes into the eco-system. When any gasket is blown our sensors notify us immediately. We tested the response time of the first arrival on the scene in order to analyze to control the response time in a real disaster. We use our Robotics/AI maintenance crew systems. We time their response time on five different sets of trial. At first the system is out of control based on R-Chart and the X-bar chart. There are outliers in both charts; the points are above the upper control limits as shown in figure 1 below. We put the charts back in control by removing outliers and the consecutive points above the central line if there were more than seven.
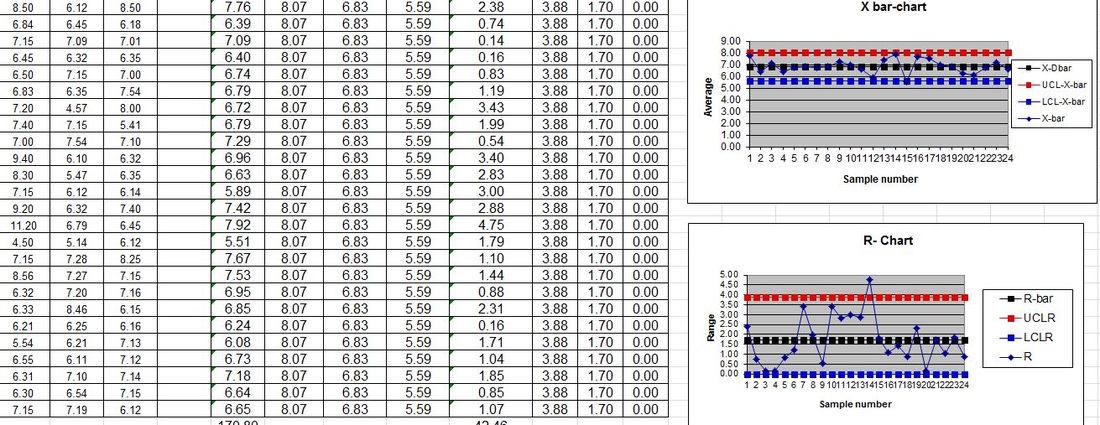
FIGURE 1
|
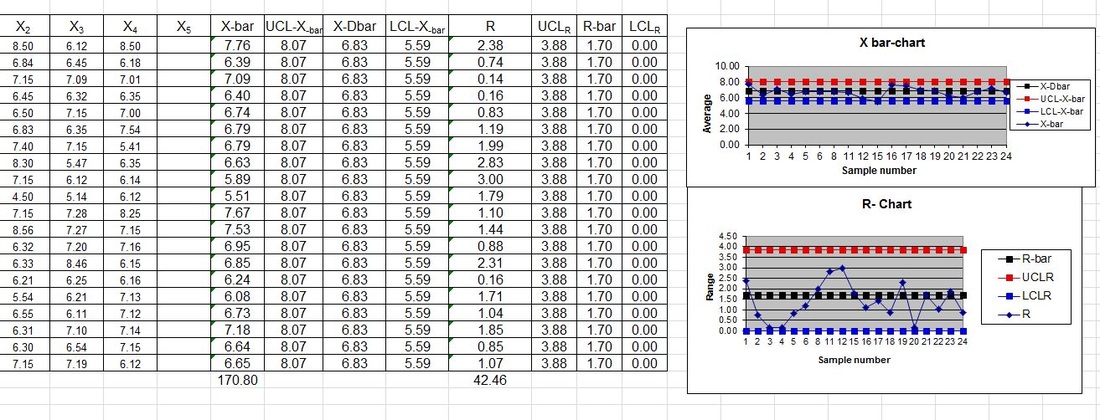
FIGURE 2
|
Control
Charts for Attributes
Our valves are installed by our Robotics/AI crew when they need to be replaced or they need repair. It is important that they go through the correct procedure when those valves need to be repair. We also need them to repair the valves correctly. We don’t want waste time or resources doing a task more than once. We want do to it correctly the first time then move to the next one. We check for non-conformities when we are done installing, repairing, or replacing a valves or a pipe. We use the control charts for attributes to make sure that our robots are doing a great job. Since we can’t quantify the fact the valves or the pipe works according to our set standard; that’s the main reason that we use this chart.
In order to construct the chart we randomly took a sample of 140. Each sample is about 3050 valves that were repair by our Robotics/AI maintenance crew. We figure out the percentage of those valves that worked after they were repaired. We constructed a control charts for attributes. At first it was out of control as shown in figure 3. We then proceed to put it back in control as shown in figure 4 by removing the outlier that was above the upper control limit.
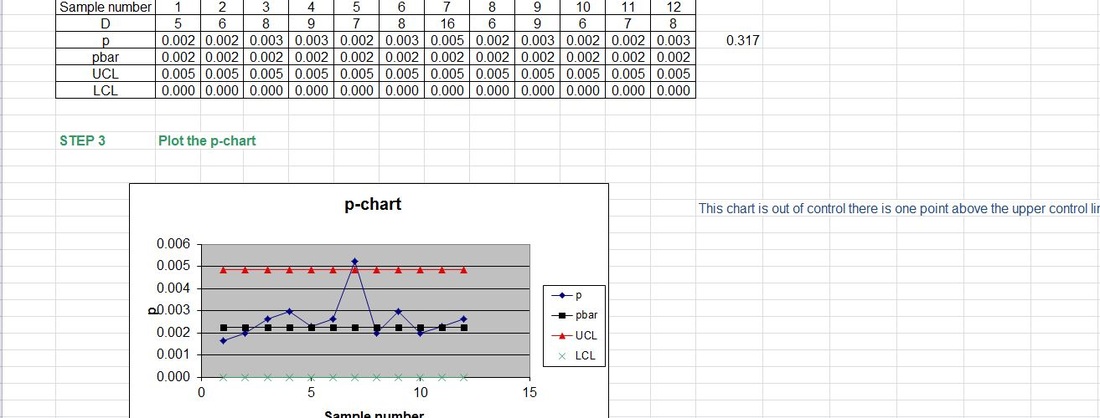
FIGURE 3
|
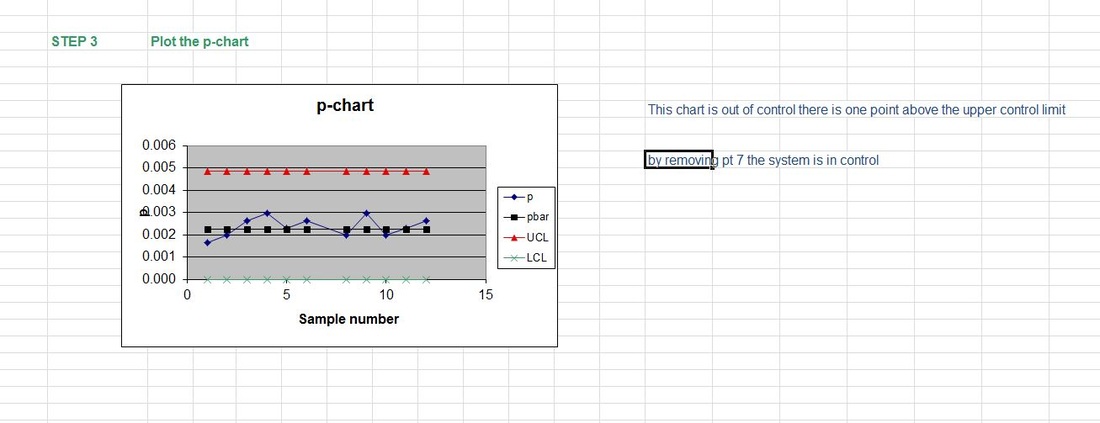
FIGURE 4
|
Collaboration
We went back to figure out the root of the problem. We have requested to help of our partners and also independent consult in order to resolve our problems. We have asked our partner Yaskawa, that is in charge of making our Robotics/AI maintenance crew to look at some their robots and figure out why they are having such a hard time repairing the valves or installing the valves. We also asked an artificial intelligence firm to assist in order to provide a better system to our Robotic/AI maintenance crew.
We also implements cameras that provide a 360 degree view of the process when installing, repair, or replacing a valve we want to document the entire process for each robot. Those cameras contain a data of a detail procedure of what each step is supposed to look like. The cameras are simultaneous sharing that information with the robot in order to improve the process. We also implement sensors in their drill guns. We want to monitor the torque level that in being put into each lug nuts. We want to keep the variation as low as possible even though we program them to put standard amount of torque.
Missing Data
The missing data that did not take into account is the variation in performance of maintenance crew. In real life there will be variation. We just want to keep it to minimum. Our statistical process provides a predictable performance expectation among our crew. We have a tolerance level when it comes to variations in our processes. We cannot afford to let our clients down. What we do as a firm is very critical. We will not tolerate any mistakes.
Results
We have analyzed the results. We made sure that we are exceeding the expectations that we had before. Our processes have to make sense mathematically. It is the reason why we use the p-Chart to make sure our processes conform to the standards that we set. We also use a control charts for variables. We want to have a very low response time in case of emergency and also when we need a piece of equipment repaired. Time for us as a firm is very critical. We cannot have high variation. We also need our robots to work well. The control charts allows us to locate the robots that we not performing to standard and remove them from the field.
Summary and further work needed
The business that we are in does not allow us to be complacent. It is important that we are running test on a daily basis and making analysis on a daily basis. We are constantly improving our process in order to provide a better service. We want to reduce variation in order to yield a higher quality of services to our clients. That is the reason we implement cameras that activated whenever our crew are conducting an operation such as repair a valve, responding to a leak, or installing a pipe. We want to visually study the process frame by frame in order to have better improvement.
References
Ranky P.G. PhD, IE 673 Total Quality Management Spring 2014 eLearning Packet 2014-63-26
Ranky, P.G.: A Case-based Introduction to Total Quality Management and the International Quality Standards,
I would give myself an A
